library(ggplot2)

ggplot(mpg, aes(x = displ, y = hwy, color = class)) +
  geom_point(alpha = 0.6) +
  geom_smooth(method = "loess", se = FALSE) +
  labs(title = "Bigger engines, thirstier cars")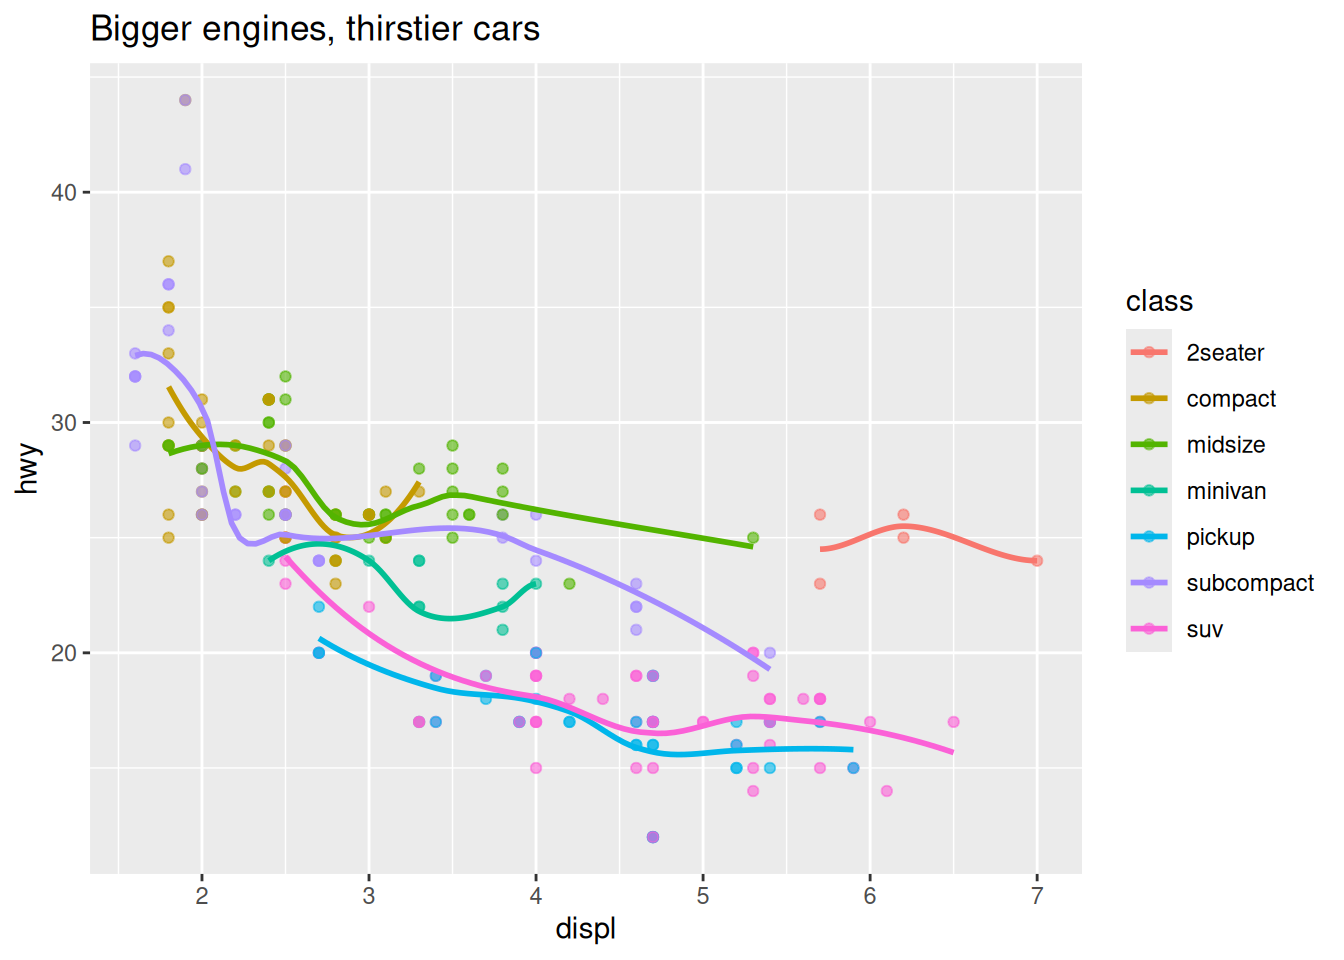
You know how to make this plot. What you usually cannot do — without writing a Shiny app by hand — is hand it to someone else and let them pick the columns, tweak the smoothing, or retitle it. ggpaintr closes that gap: take the ggplot2 call you already have, mark each choice you want to hand over, and you get a working Shiny app in return. No UI code, no server function, no reactive plumbing.
Here is an ordinary ggplot2 plot:
library(ggplot2)
ggplot(mpg, aes(x = displ, y = hwy, color = class)) +
geom_point(alpha = 0.6) +
geom_smooth(method = "loess", se = FALSE) +
labs(title = "Bigger engines, thirstier cars")
Now replace each value a viewer should control with a placeholder keyword — ppVar for a column, ppNum for a number, ppText for text — and pass the whole expression to ptr_app():
ptr_app(
  ggplot(mpg, aes(x = ppVar("displ"), y = ppVar("hwy"), color = ppVar("class"))) +
    geom_point(alpha = ppNum(0.6)) +
    geom_smooth(method = ppText("loess"), se = FALSE) +
    labs(title = ppText("Bigger engines, thirstier cars"))
)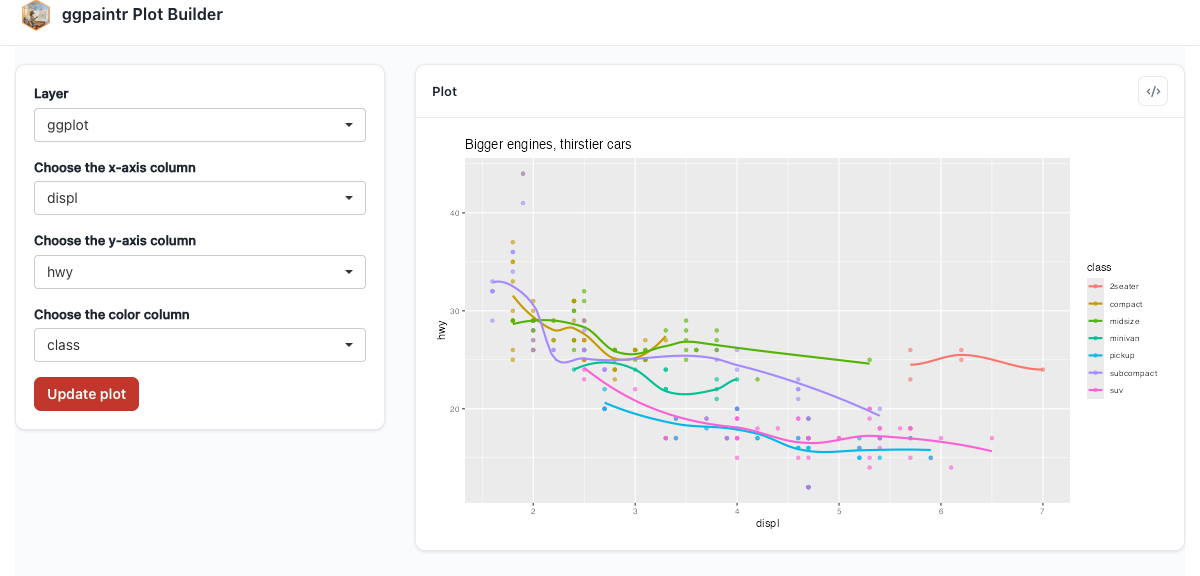
ppVar became a column dropdown seeded with your starting choice, and the plot redraws when Update plot is clicked. The alpha, smoothing-method, and title widgets live under their own entries in the Layer dropdown.Each placeholder became an input widget, the dropdowns already know the columns of mpg, and the app can show its viewer the generated ggplot2 code for whatever they built — ready to paste back into a script. That round trip (plot → app → code) is the heart of the package.
You need to know ggplot2 to read this book. You do not need to know Shiny — the first half of the book never touches it. The chapters on embedding ggpaintr inside your own Shiny app (Chapter 9 onward) say so when Shiny knowledge starts to matter.
ggpaintr exposes three levels, and choosing the right one up front saves rework. This book’s parts follow what you want to do; the levels are the vocabulary used along the way.
| Level | Entry points | Use when | Where in this book |
|---|---|---|---|
| L1 | ptr_app() |
The built-in chrome — title bar, layer picker, plot pane, code window — is enough. | Chapter 2 |
| L2 | ptr_ui() / ptr_server() |
You own the surrounding Shiny app and want ggpaintr plots inside it. | Chapter 9 |
| L3 | bare UI pieces (ptr_ui_page, ptr_ui_controls, …) |
You own the page layout, the renderer, or both. | Chapter 12, Chapter 13 |
L1 is the dominant use case: hand ggpaintr a formula, get back a running Shiny app.
The built-in placeholders cover columns, numbers, text, expressions, and uploads — but the widget vocabulary is not fixed. Defining your own placeholder takes a keyword, a widget, and a rule for turning the widget’s value back into code. The gallery’s friendlier alpha control, ppPercent, is one in about twenty lines:
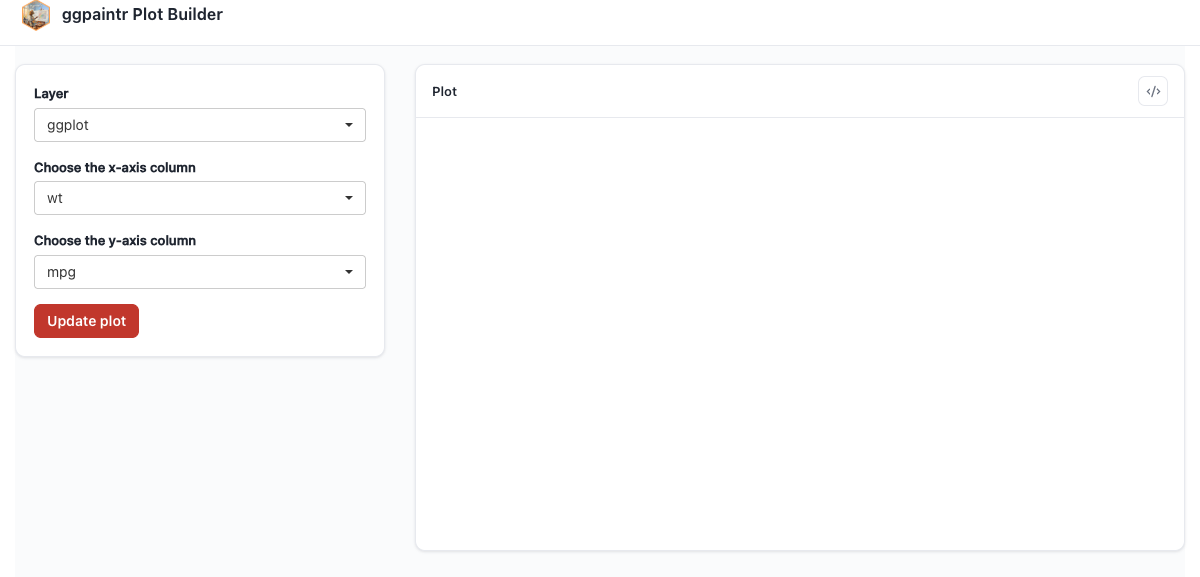
ppPercent placeholder rendering as a 0–100 slider; the generated code reads alpha = 0.4.This is where ggpaintr stops being a fixed app generator and becomes a toolkit; Chapter 6 teaches it early because most real apps want at least one widget the built-ins don’t provide.
An honest scoping note, so you can put the book down early if it is not for you:
Part I gets you from zero to a running app. Part II covers the formula language and the built-in placeholders. Part III teaches custom placeholders. Part IV embeds ggpaintr in your own Shiny app — Shiny knowledge starts there. Part V restyles the result, Part VI covers safe sharing and the LLM integration, and the final part is a gallery of complete examples to raid (Chapter 20). The cheatsheet appendix condenses the whole API onto one page.