ptr_app(
  mtcars |>
    dplyr::filter(ppExpr(mpg > 15)) |>
    ggplot(aes(x = ppVar, y = ppVar, color = ppVar)) +
    geom_point(size = ppNum) +
    labs(title = ppText)
)3 The Built-in Placeholders
A placeholder keyword marks one decision you are delegating to the app’s user. ggpaintr ships five. Each maps to a fixed widget and a fixed way of folding the user’s input back into the formula:
| Keyword | Widget | Role | Folds back as |
|---|---|---|---|
ppVar |
column picker (data-aware) | consumer | a column symbol, e.g. mpg |
ppText |
text input | value | a string |
ppNum |
numeric input | value | a number |
ppExpr |
code box (validated) | value | live code, parsed to an expression |
ppUpload |
file picker (+ dataset-name box) | source | a data frame |
The role column matters as soon as you want to define your own placeholders (Chapter 6):
- A value placeholder produces a self-contained value — it needs nothing from the rest of the formula.
- A consumer placeholder needs the upstream data’s column names: a
ppVardropdown can only list columns once it knows what data flows into it. - A source placeholder produces the data frame the rest of the formula reads.
3.1 Placeholders work anywhere in a pipeline
A formula can mix all the roles, and placeholders are not confined to the ggplot() call — any pipeline stage ahead of it can carry them too:
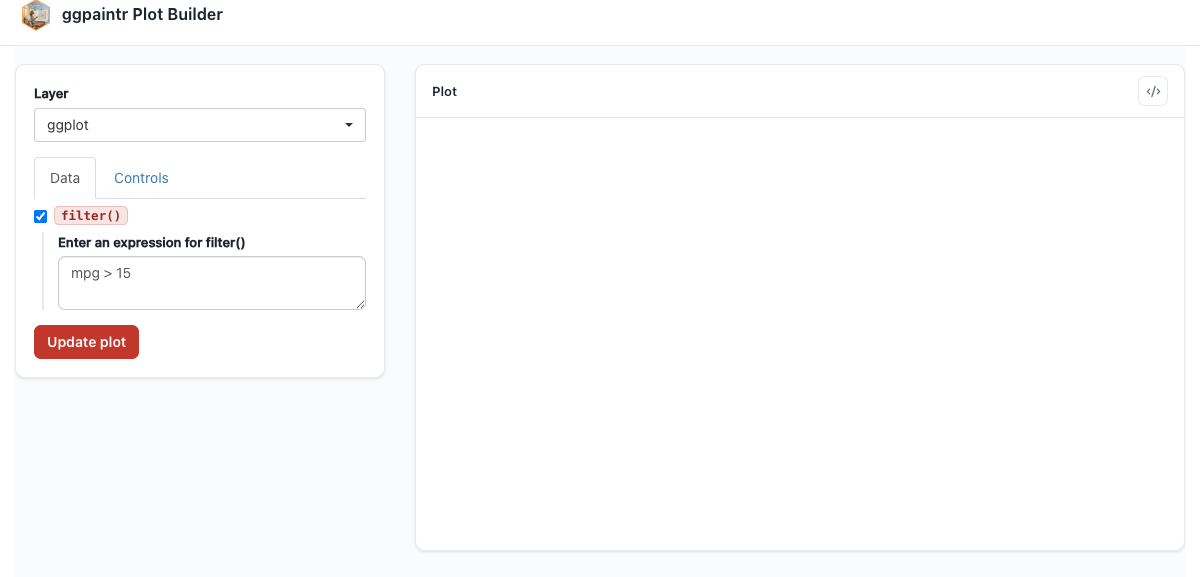
ppExpr code box for the filter (seeded with mpg > 15), three column pickers, a numeric input for point size, and a text input for the title.Column pickers downstream of a pipeline stage re-resolve their choices against the current upstream inputs, so changing the filter immediately refreshes the pickers below it. The full pipeline story — which stage shapes are supported and which are not — is in Chapter 4.
3.2 Seeding: defaults are literal, never evaluated
Any placeholder takes a single positional argument as its boot value: ppVar("wt") (a string) or ppVar(wt) (a bare name) pre-picks the column, ppNum(3) pre-fills the number, ppText("A title") the text, ppExpr(mpg > 15) the code box. The default is read literally from the formula text; it is not evaluated as user code. The one convenience: ppNum accepts simple arithmetic such as ppNum(2 * pi), folded at build time against a small allowlist of pure functions.
3.3 ppUpload: the data comes from the user
ppUpload is the source placeholder: it renders a file picker plus a dataset-name box. Seed it with a bare dataset name and the app boots against that data with no upload needed — the upload widget stays available to swap it out:
ptr_app(
  ppUpload(iris) |>
    ggplot(aes(x = ppVar(Sepal.Length), y = ppVar(Sepal.Width), color = ppVar(Species))) +
    geom_point()
)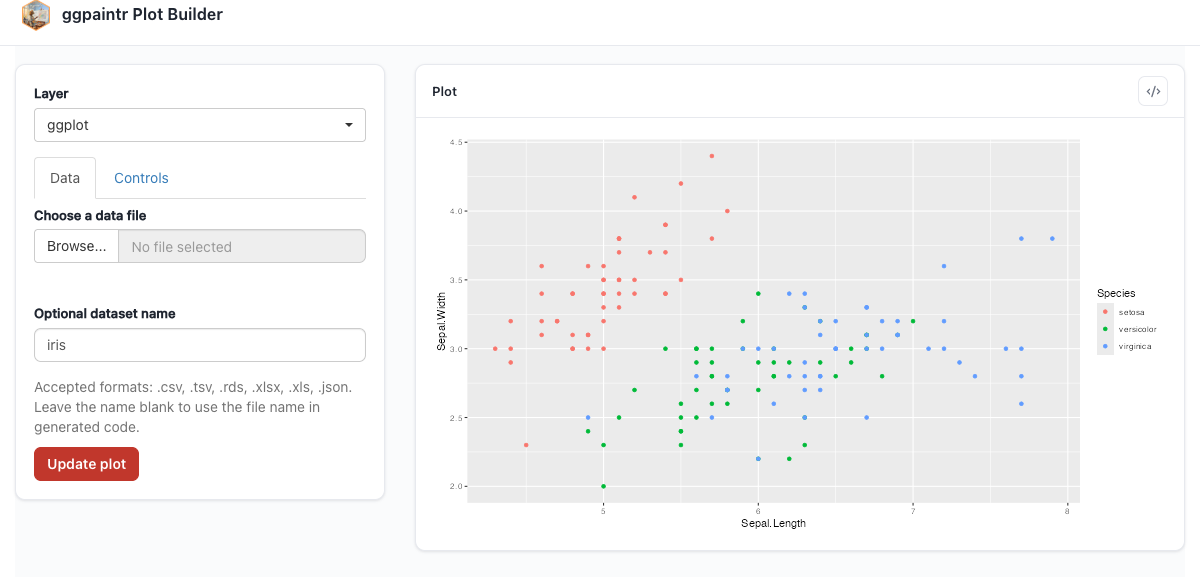
ppUpload(iris) seeds the app with iris; the seeded column pickers let the first Update plot draw immediately. Uploading a file re-points every downstream picker at the new columns.Uploaded column names are normalized automatically so that ppVar always sees syntactic, unique names (Chapter 5 covers the same normalization for local data). The trust model behind ppExpr validation and ppUpload parsing — what is checked, what is not — has its own chapter: Chapter 18.
3.4 Nothing renders until you click Update
Under the default gate_draw = TRUE setting, ggpaintr re-draws only on Update plot. Changing a widget stages a new value but does not redraw on its own. (Setting ptr_options(gate_draw = FALSE) before building the app removes the button and re-renders live on every change.) This is deliberate: it keeps a half-typed expression from strobing the plot, and it is the one thing to remember when scripting an app in tests — set the inputs, then click the button.
3.5 Beyond the built-ins
When none of the five fits — you want a slider, a range, a multi-column picker — you register your own placeholder with the same three roles. That is Chapter 6; the gallery (Chapter 20) uses several custom placeholders in realistic plots if you want to see them in action first.